5 Typology Construction (quantitative)
5.1 Why use this method?
Quantitative typology construction is a core task in urban morphometrics1, as it is meant to reveal patterns in large amounts of data and/or variables that would otherwise be invisible. Compared to qualitative typology construction, it enables scalability, allowing the analysis of large datasets and a large number of variables that could not be processed manually.
The underlying quantitative method is cluster analysis, an unsupervised machine learning method which is used to identify a given number of clusters in a dataset. Those clusters are then used to define types that can either simply describe the sought patterns or guide type-specific spatial decisions.
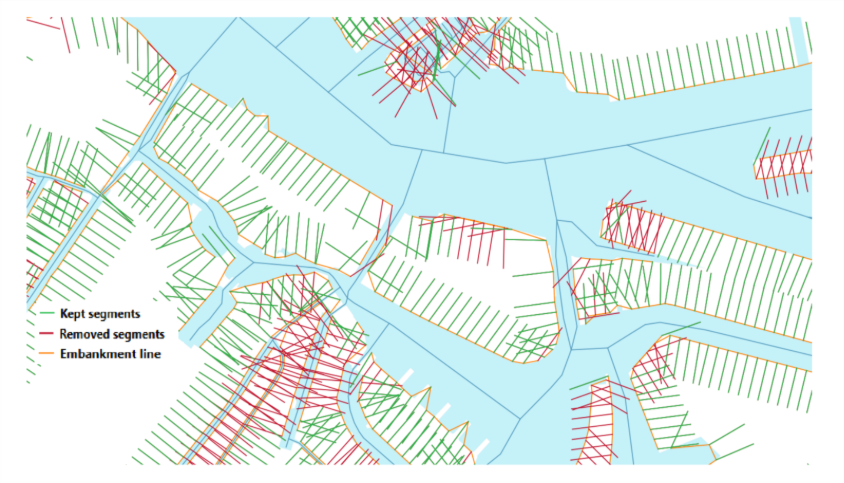
This example of student work used quantitative typology construction analyse data collected from river cross-sections. The initially generated cross-sectional segments were cleaned before analysis, removing any deemed invalid, for examples, those cutting through another river’s embankment line (Figure 5.2).
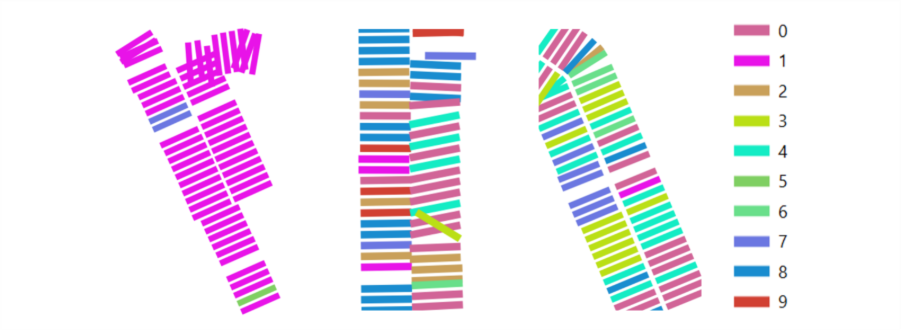
The k-means clustering method resulting in 6 proposed typologies: Urbanized riverbanks (0,6,8), Lush natural floodplains (1), Barren paved land (2), Residential tree-covered space (3,5), Balanced riverside corridor (4,9), and Mixed green strips (7) (Figure 5.3).
5.2 You are ready to use this method if:
You know the difference between quantitative and qualitative methods
You know how to derive quantitative variables from spatial analysis
5.3 Questions you can answer
What types of spatial configurations and/or compositions are found in a given urban area?
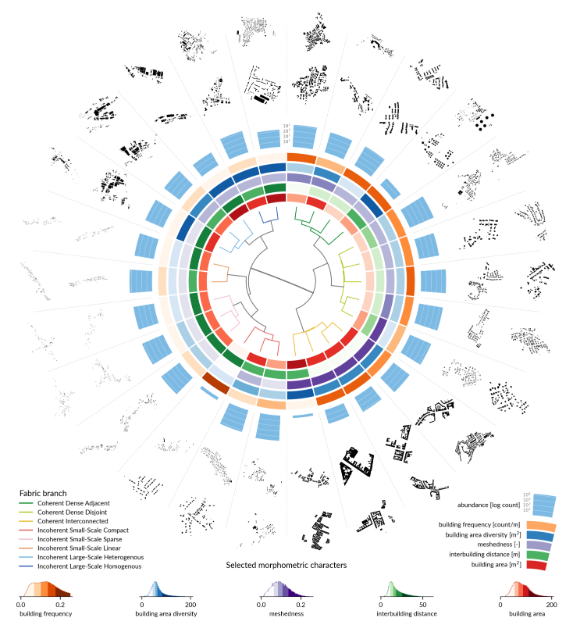
What morphological patterns can we see across a given number of cases? See the Urban Taxonomy.
5.4 Steps
Define the spatial unit (e.g., building, block, parcel, street, neighbourhood).
Collect relevant morphological variables: direct measurements or derived metrics
Use those variables as input in a clustering algorithm (the simplest is k-means). The number of clusters is either defined deductively (you know beforehand how many there should be) or empirically (you try out different numbers of clusters and search for an optimum either quantitatively or qualitatively).
You examine representative examples to interpret the clusters. Then you name and describe them.
5.5 Tools
GeoDa –> tutorial
R –> tutorial (Basic experience in R is needed. If you’re new to R, our Geospatial Data Carpentry for Urbanism provides a useful introduction.)
5.6 Cases
5.7 References
5.8 Exercises
5.8.1 Exercise 1 — Constructing and Interpreting an Urban Morphological Typology
Select a continuous urban area (minimum 1 km²) in a city of your choice. Using quantitative urban morphometrics, construct a morphological typology based on measurable spatial characteristics. Interpret the resulting types and discuss how they could inform urban design or planning decisions.
Tasks
Define an appropriate spatial unit (e.g. building, block, street segment, parcel, or neighbourhood).
Select and compute at least 6 morphological variables (e.g. density, compactness, building height, plot coverage, street connectivity).
Apply a cluster analysis method (e.g. k-means) to generate an urban typology.
Interpret and name the resulting clusters:
Describe their morphological characteristics
Identify representative examples spatially
Reflect on:
What patterns are visible through this method?
How could these types guide design interventions?
Deliverables
Maps of clusters
Variable summary table
Cluster descriptions
Short reflection